UARoads — startup for monitoring road quality


For many years, the stfalcon.com team had been working on developing a web service and applications for the UARoads project. In July 2018, we transferred it to another team, which continues to develop the service. Below you can learn about the development process.
Task
UARoads is a startup created by stfalcon.com and probably our most favorite project. The quality of Ukrainian roads is far from being good — 95% of all roads are in unsatisfactory condition. Bad road surface increases the risk of traffic accidents and influences car maintenance costs. That’s why in 2013 we have launched our startup for drivers called UAroads.
The main goal of the project is to join efforts and identify the most comfortable, quick and safe roads that have less holes in them. UARoads helps to:
- Increase driving safety by helping to choose roads with better surface.
- Protect cars from damage caused by poor road quality and save money spent on frequent repair.
- Reduce government expenditure on monitoring road quality.
- Monitor activities of the road services and the quality of road maintenance.
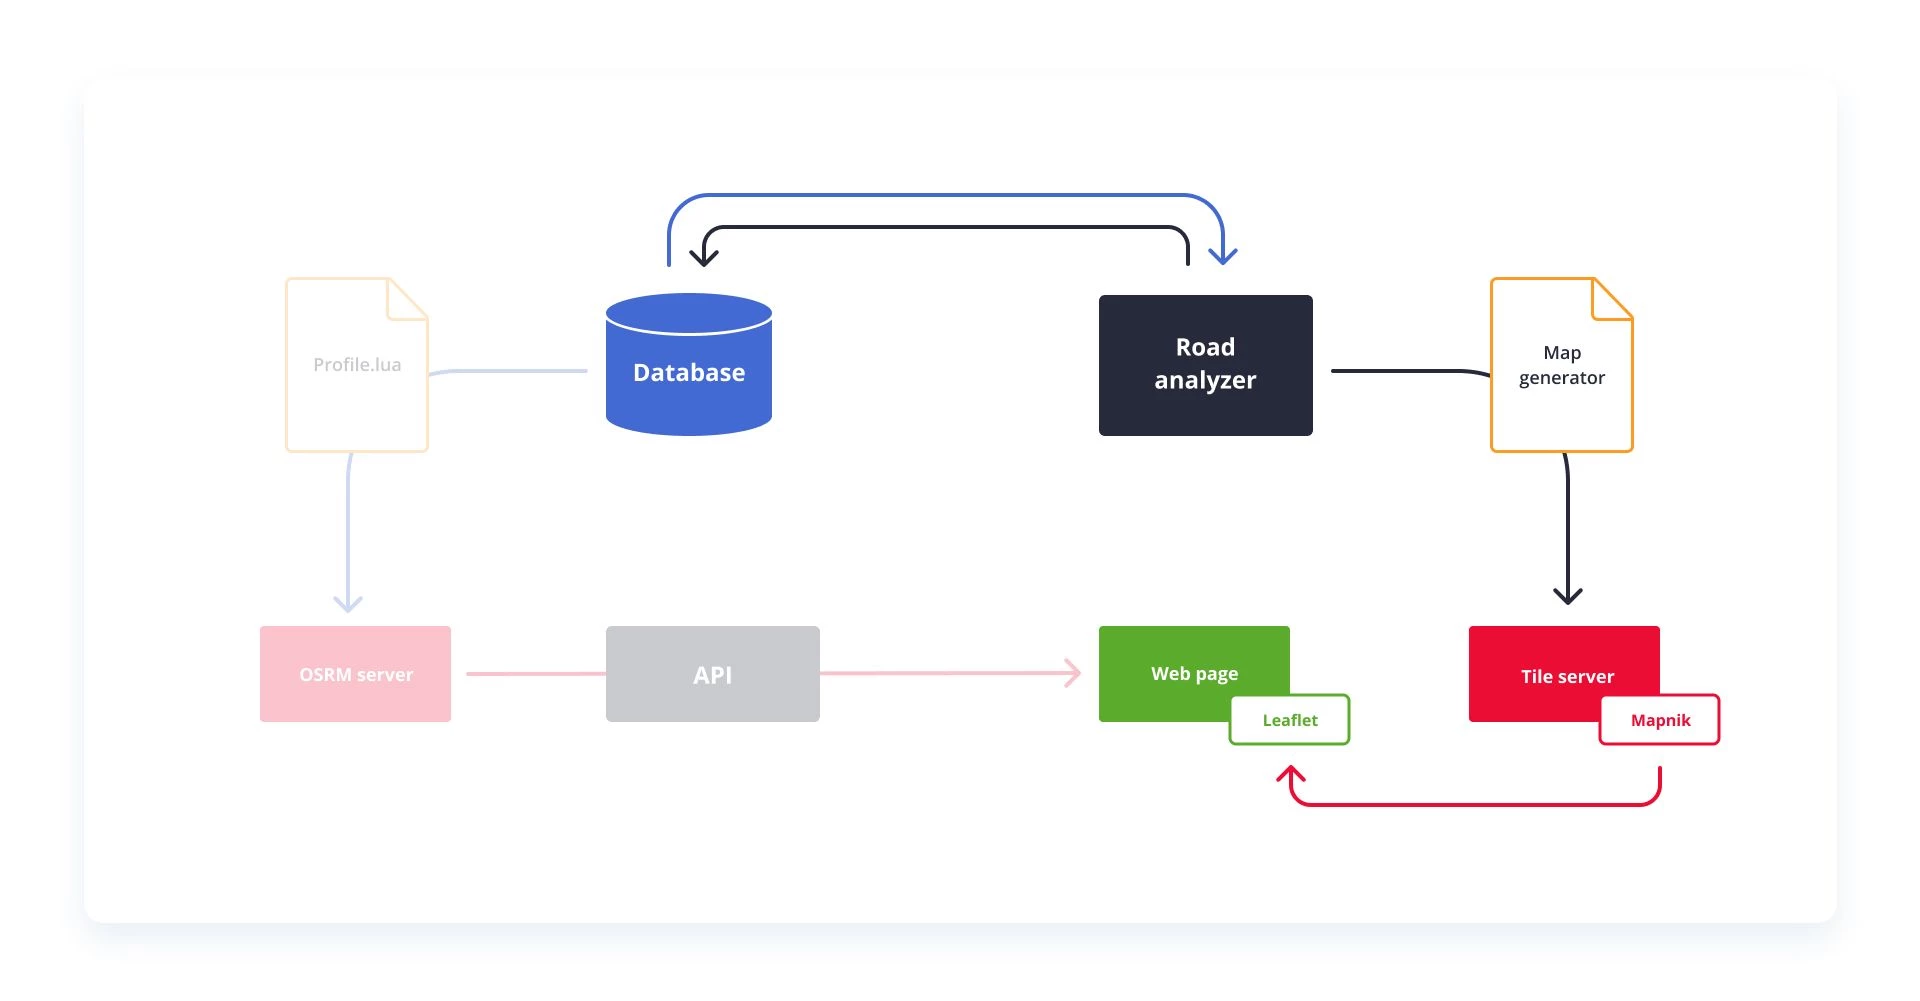
Structure
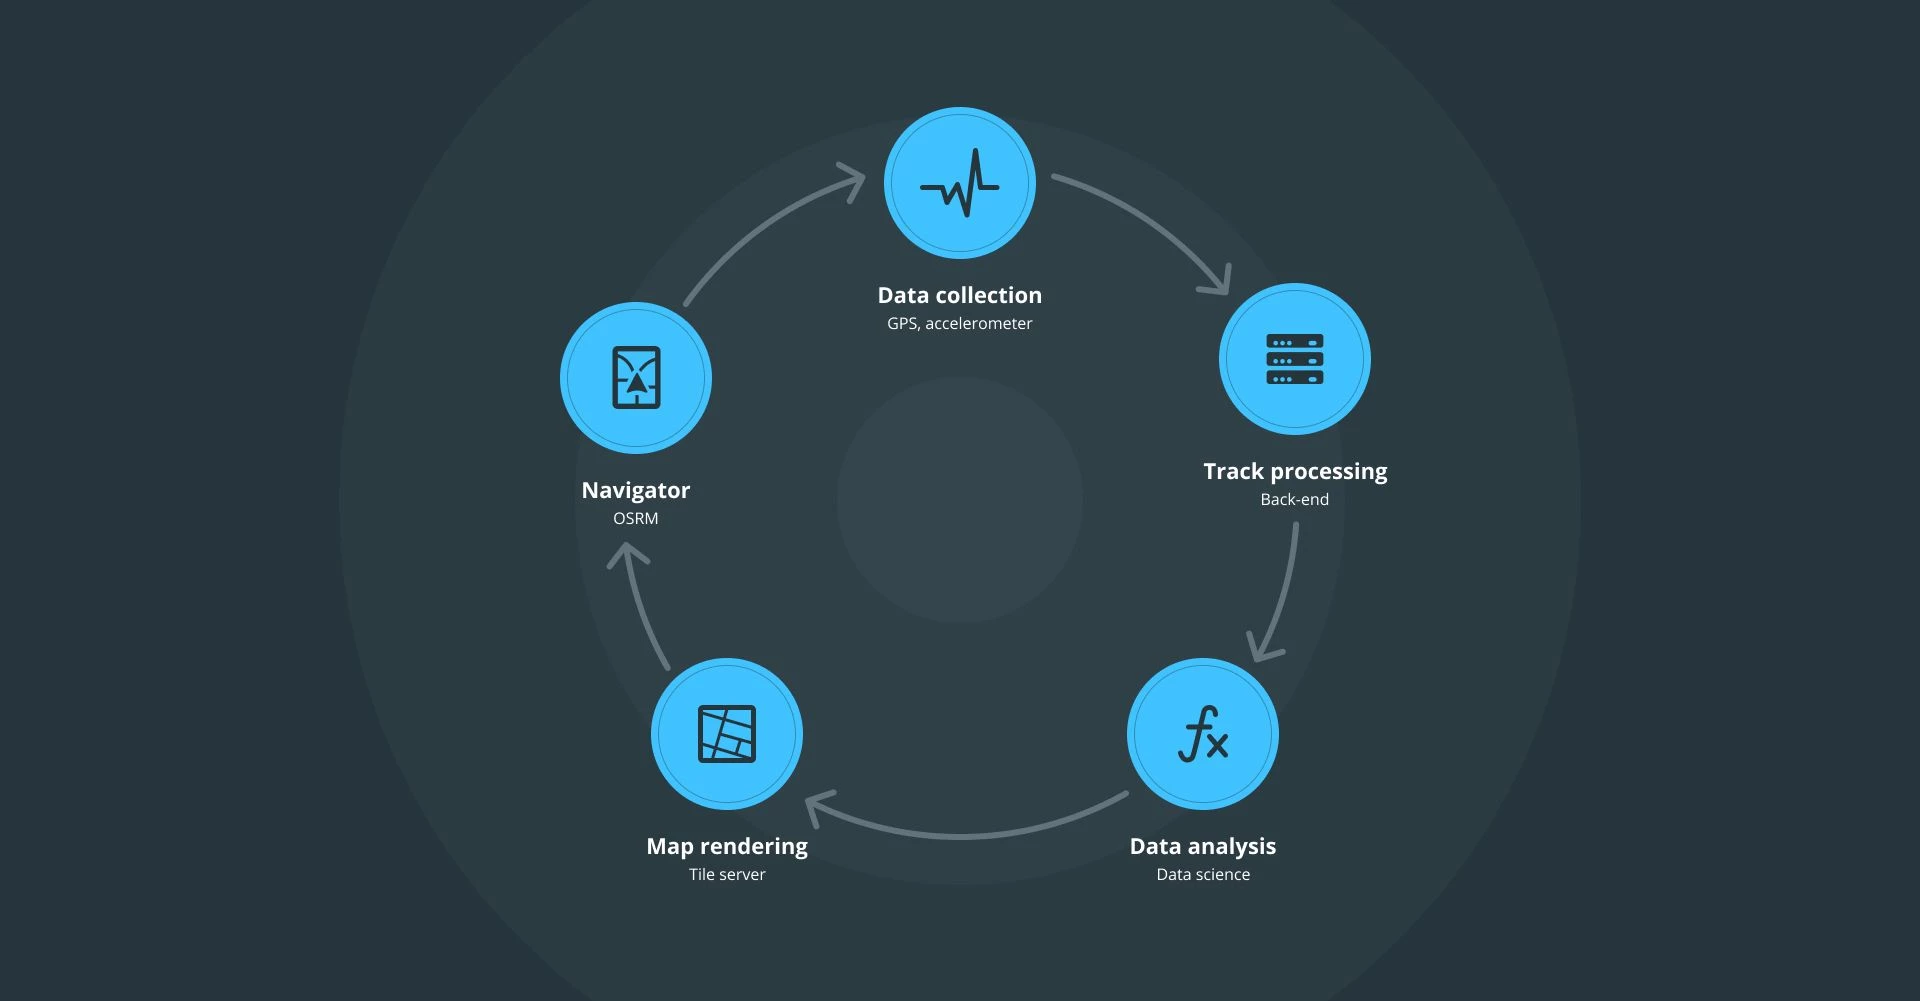
UARoads service consists of:
- main website with the map of road quality (front-end)
- track processing system (back-end)
- analysis tools (data science)
- service for rendering maps (tile server)
- service for finding an optimal route (OSRM)
The project can also be divided into 2 parts: navigation and showing road conditions on the map. Of course, everything starts with collecting raw data.
Collecting raw data
The core principle of UARoads is recording data on shakes using mobile devices and binding them with GPS coordinates. Data collection is performed automatically by the mobile application available for Android, iOS and Windows Phone. Android and iOS versions were developed by studio employees and Windows Phone version was created by volunteers from UARoads community. Drivers install app on their mobile devices and the app takes care of everything. Drivers are not distracted from the road. The app is automatically recording data on shakes, saves data from accelerometer and writes GPS coordinates into a track as well as turns on and off. When the driver connects mobile device to Wi-Fi or data network, this data is transferred to our server.
App starts collecting data when accelerometer tells it that the car is moving. All data transferred to our server is anonymous: it doesn’t contain information about drivers or their cars.
Routing and navigation
In order to build routes via better roads we use our own routing service. Developing this kind of service from scratch is a very time-consuming and resource-intensive task so we’ve decided to use one of the open source solutions. We’ve chosen OSRM because it is easy to configure with LUA scripting language.
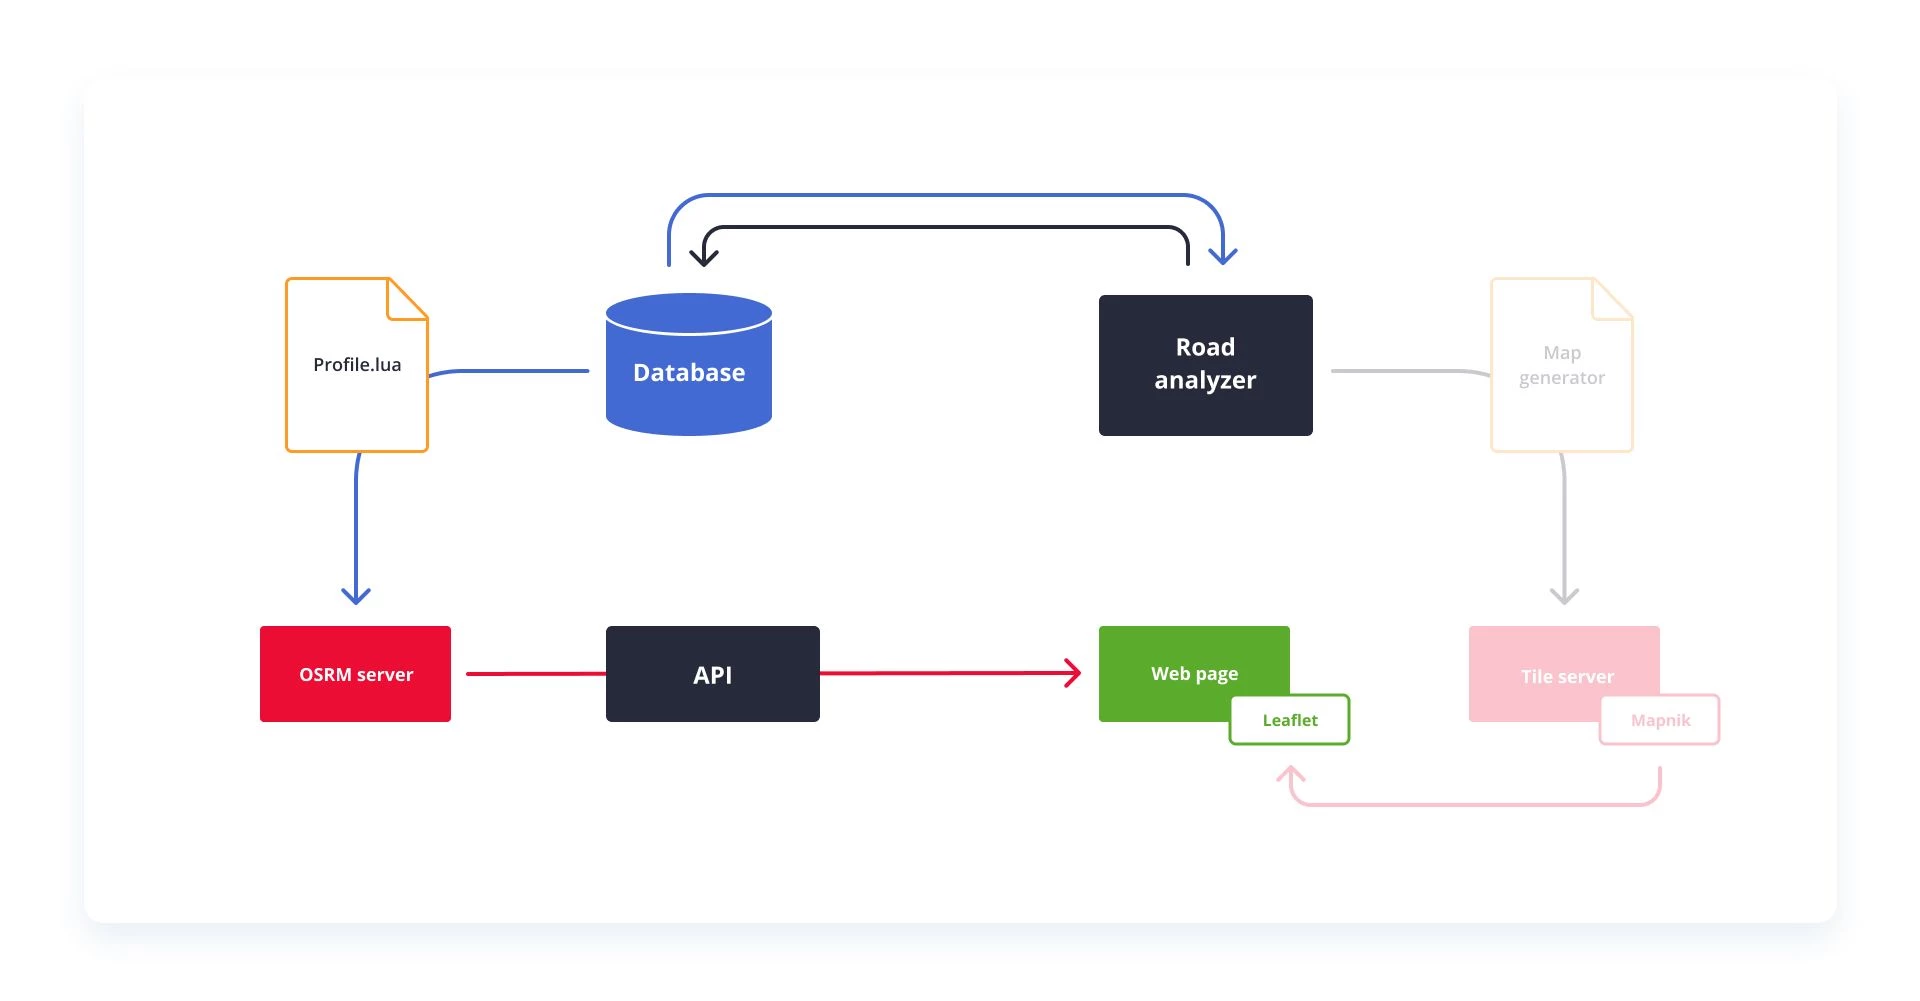
For OSRM we were using our own LUA-based configuration profile. When building routes it takes into account not only the length of the road part (graph) but also its type, average speed and road quality. Data base on the quality of road surface is updated daily. OSRM server is using REST API. The client sends a request with coordinates of the starting and ending point of the route and the server calculates the route and returns the result in the form of a JSON object.
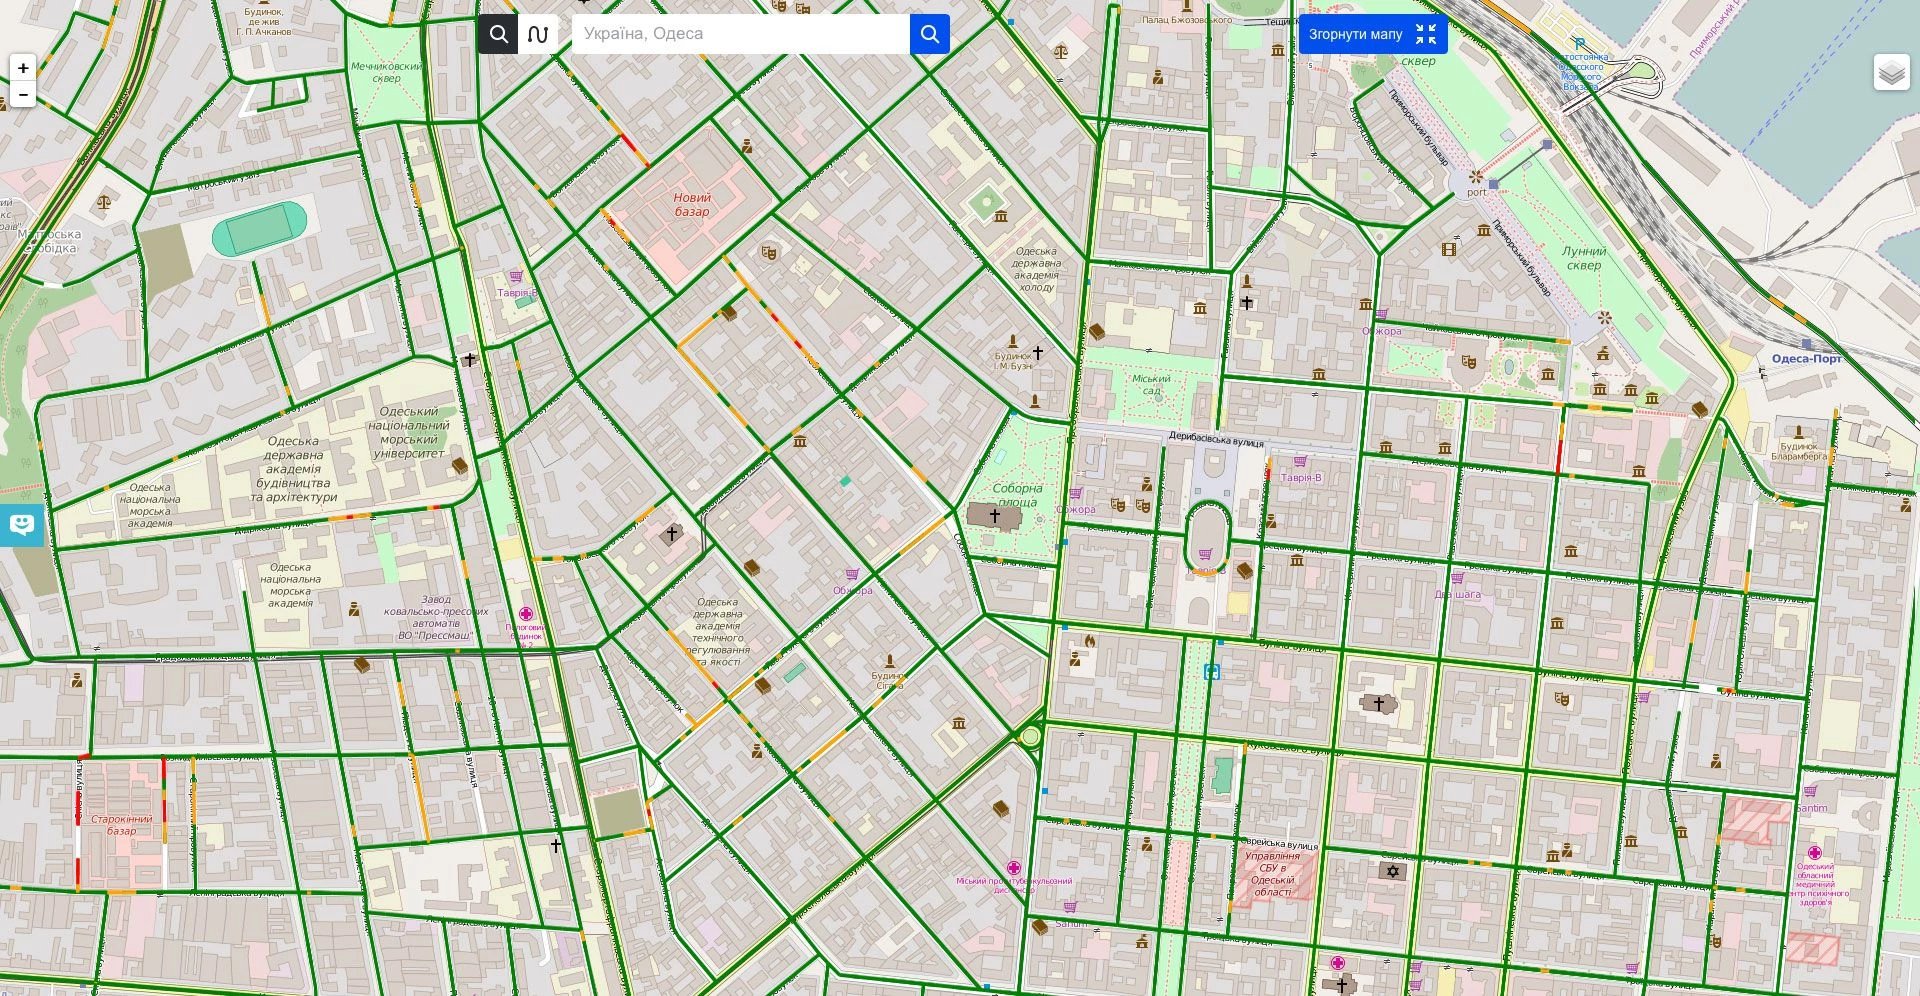
Map of the road conditions
UARoads startup uses open source map-making solutions:
- OpenStreetMap (OSM) — for building routes.
- Mapnik toolkit — for rendering raster maps from the vector data.
- Leaflet JavaScript library — for showing maps on mobile and desktop devices.
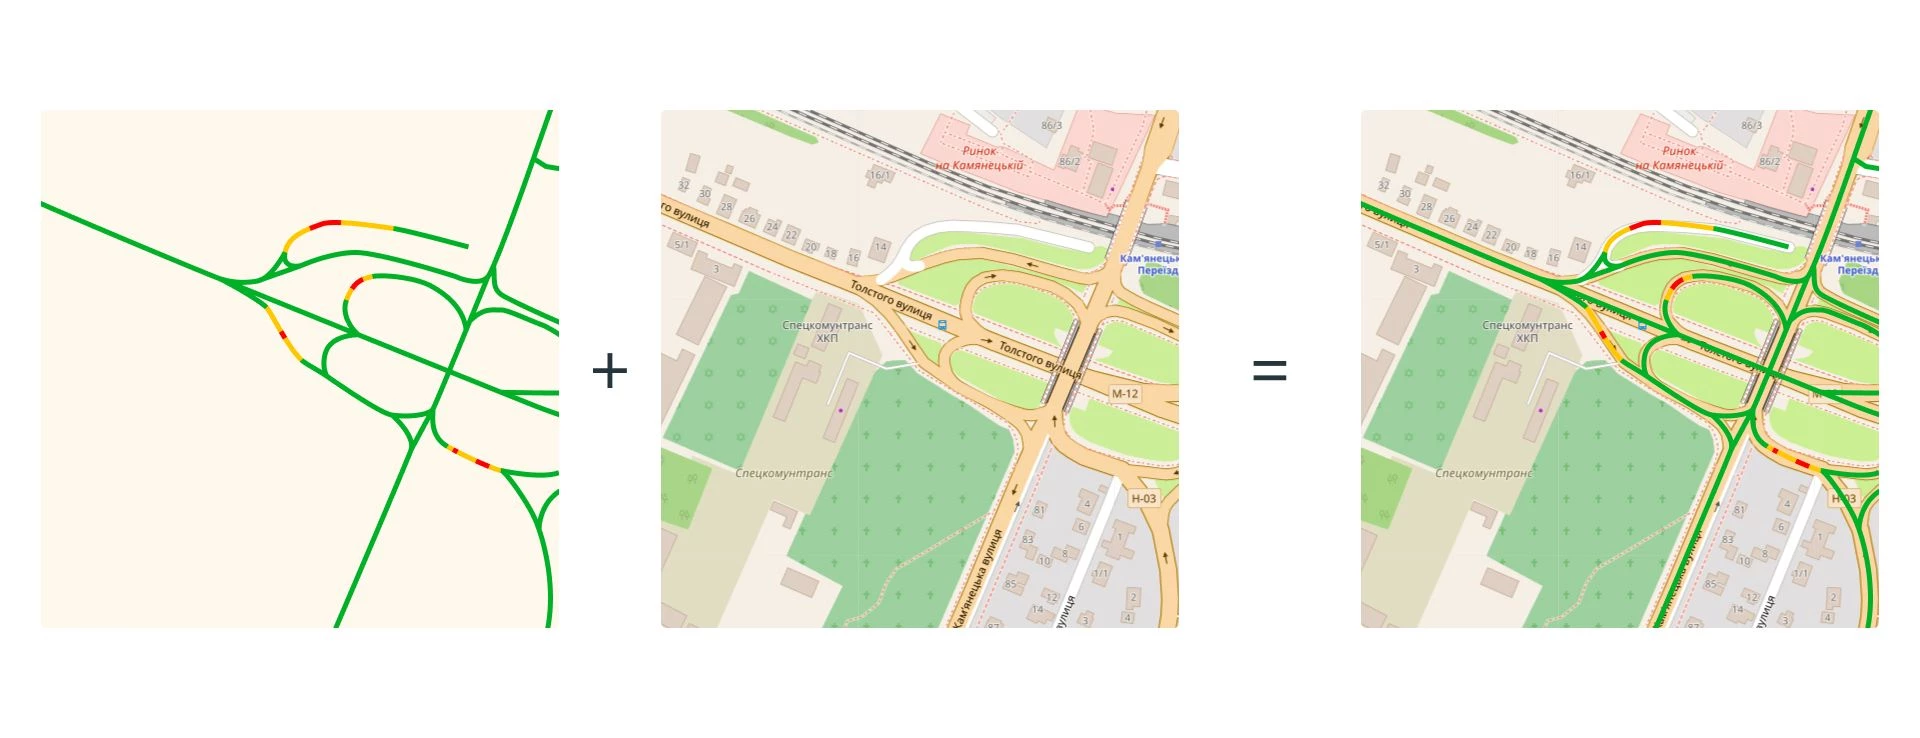
Tiles
Map on the UARoads website consists of two main layers:
- world layer that uses OSM tile server
- layer with the state of the roads that works on our own tile server
For easy map display its image is divided into tiles. Tiles are 256 x 256 px squares. When users open the map in their browser, only tiles that are viewed this time are loaded. It speeds up display time and save Internet traffic.
Here’s a tile showing data on road conditions:
Maps are rendered by the tile server:
- When the tile is requested the server checks whether its available in cache and if it is, the server sends it to the client.
- If the tile wasn’t found, it is rendered, saved in cache and then sent to the client.
Mobile app design
Users who want to have access to their personal statistics on UARoads website and participate in user rating need to create an account.
Mobile app development
UARoads project was different from everything we had done before. There were no full description of business processes, algorithms and operation principles available. Therefore, the development team had to create a prototype of the app that will be collecting raw data from all possible device sensors, store it in way that would allow further analysis and show it in real time. This experimental prototype was meant to help our team confirm the hypothesis and discover patterns in data streams. Based on the discovered patterns we were planning to create algorithms solving problem of analyzing condition of the road surface.
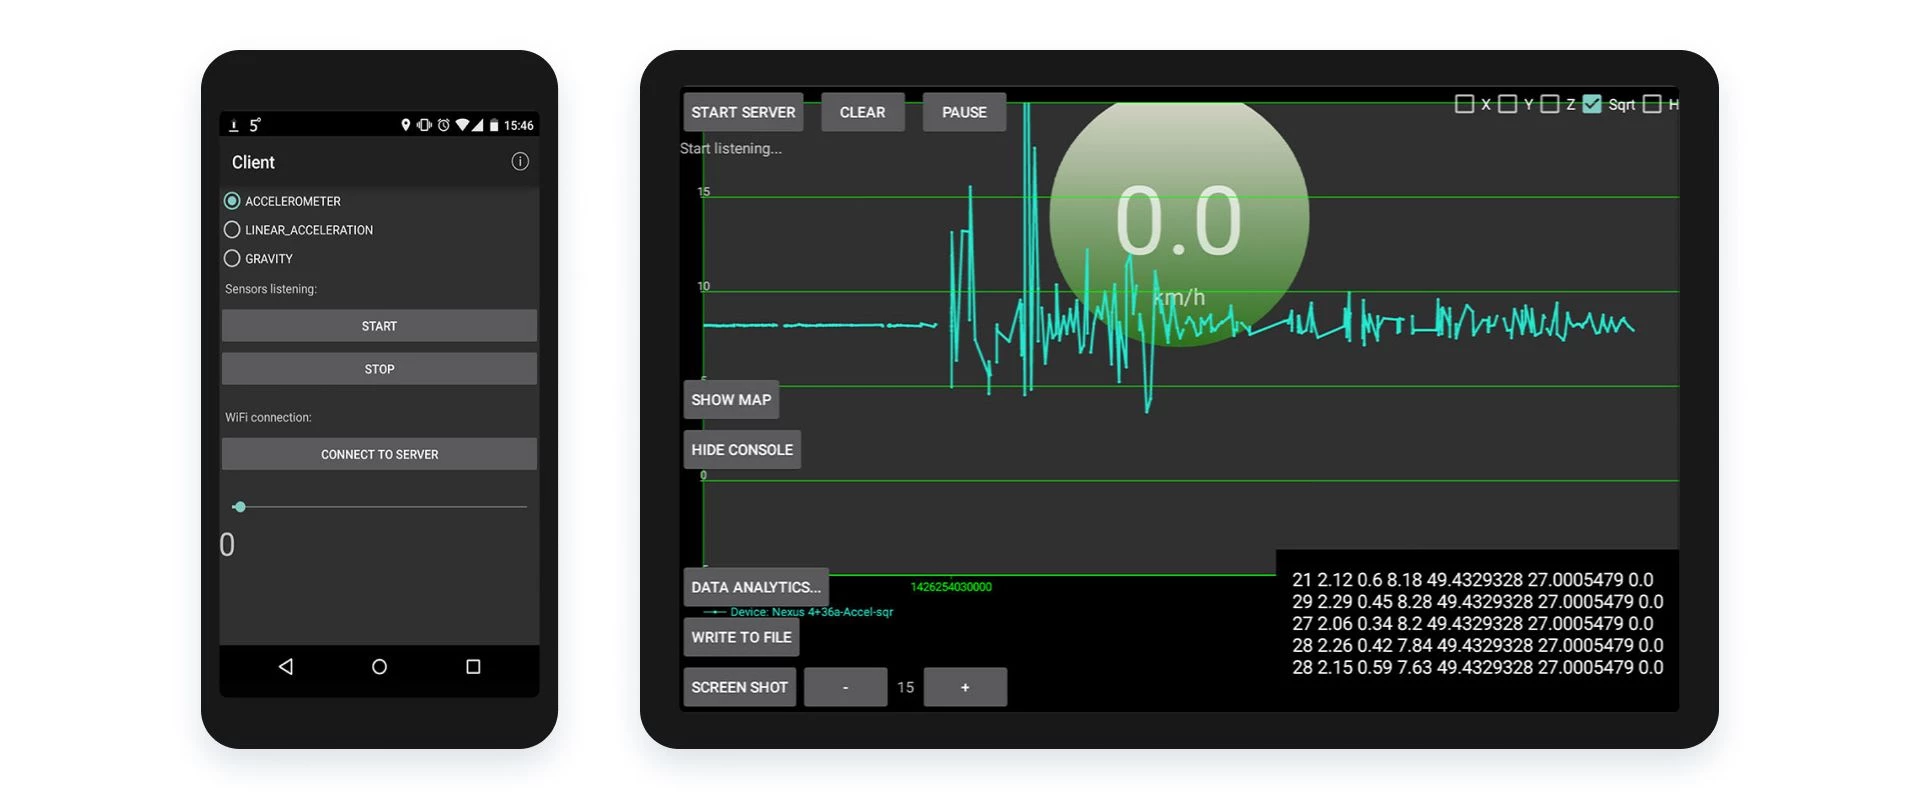
After the prototype was ready developers and mathematician team proceeded with field experiments. The prototype consisted of two apps:
- Client installed on devices used in the field experiment.
- Server installed on the tablet.
Server application created a Wi-Fi network for all the clients to join. During the experiment all the client devices were transferring data to the server in real time. First applications were very simple and had a minimum number of options:
Experiment procedure
Experimental tests were conducted according to all scientific requirements. We chose a reference section of the road which was used for experiments. This section had all types of road surface defects (holes, cracks, potholes, upheavals and ruts). They were all measured with tape measure, their descriptions and schematic illustrations were recorded for result analysis.
On the day of the experiment test devices were placed in those parts of the car where drivers usually put them (holders, arm rests, dashboard, etc.). The driver ride through the test section several times at specified speeds while the experimenter was looking at the data flow from all the test devices in real time and simultaneously making notes on the rides made through the test section of the road. Then the team came back to the office and analyzed the collected data. Based on the results of this analysis we made changes to the current version of the app and repeated the process.
Before getting the first working version of the algorithm we had several iterations of field experiments. We used several different types of cars with different drivers to eliminate the influence of driving style on the final result. We also conducted a series of experiments on dirt roads.
At the end of this stage the team had an application that correctly collected the required data and sent it to the server.
Experiment results
The experiments have given us a clear understanding of the car physics, vibrations that occur when driving through different types of road defects, impact strength and how car speed influences the end results.
But the data collected during the experiments helped us to solve only the first part of the problem, namely how users will be collecting data. The second part — road condition analysis and its classification for the map users currently see on UARoads website — was still there. To solve it we needed far more tracks that we could get during the experiments. We decided to launch a user version prior to launching website in order to gather a new body of data necessary for further development of the project.
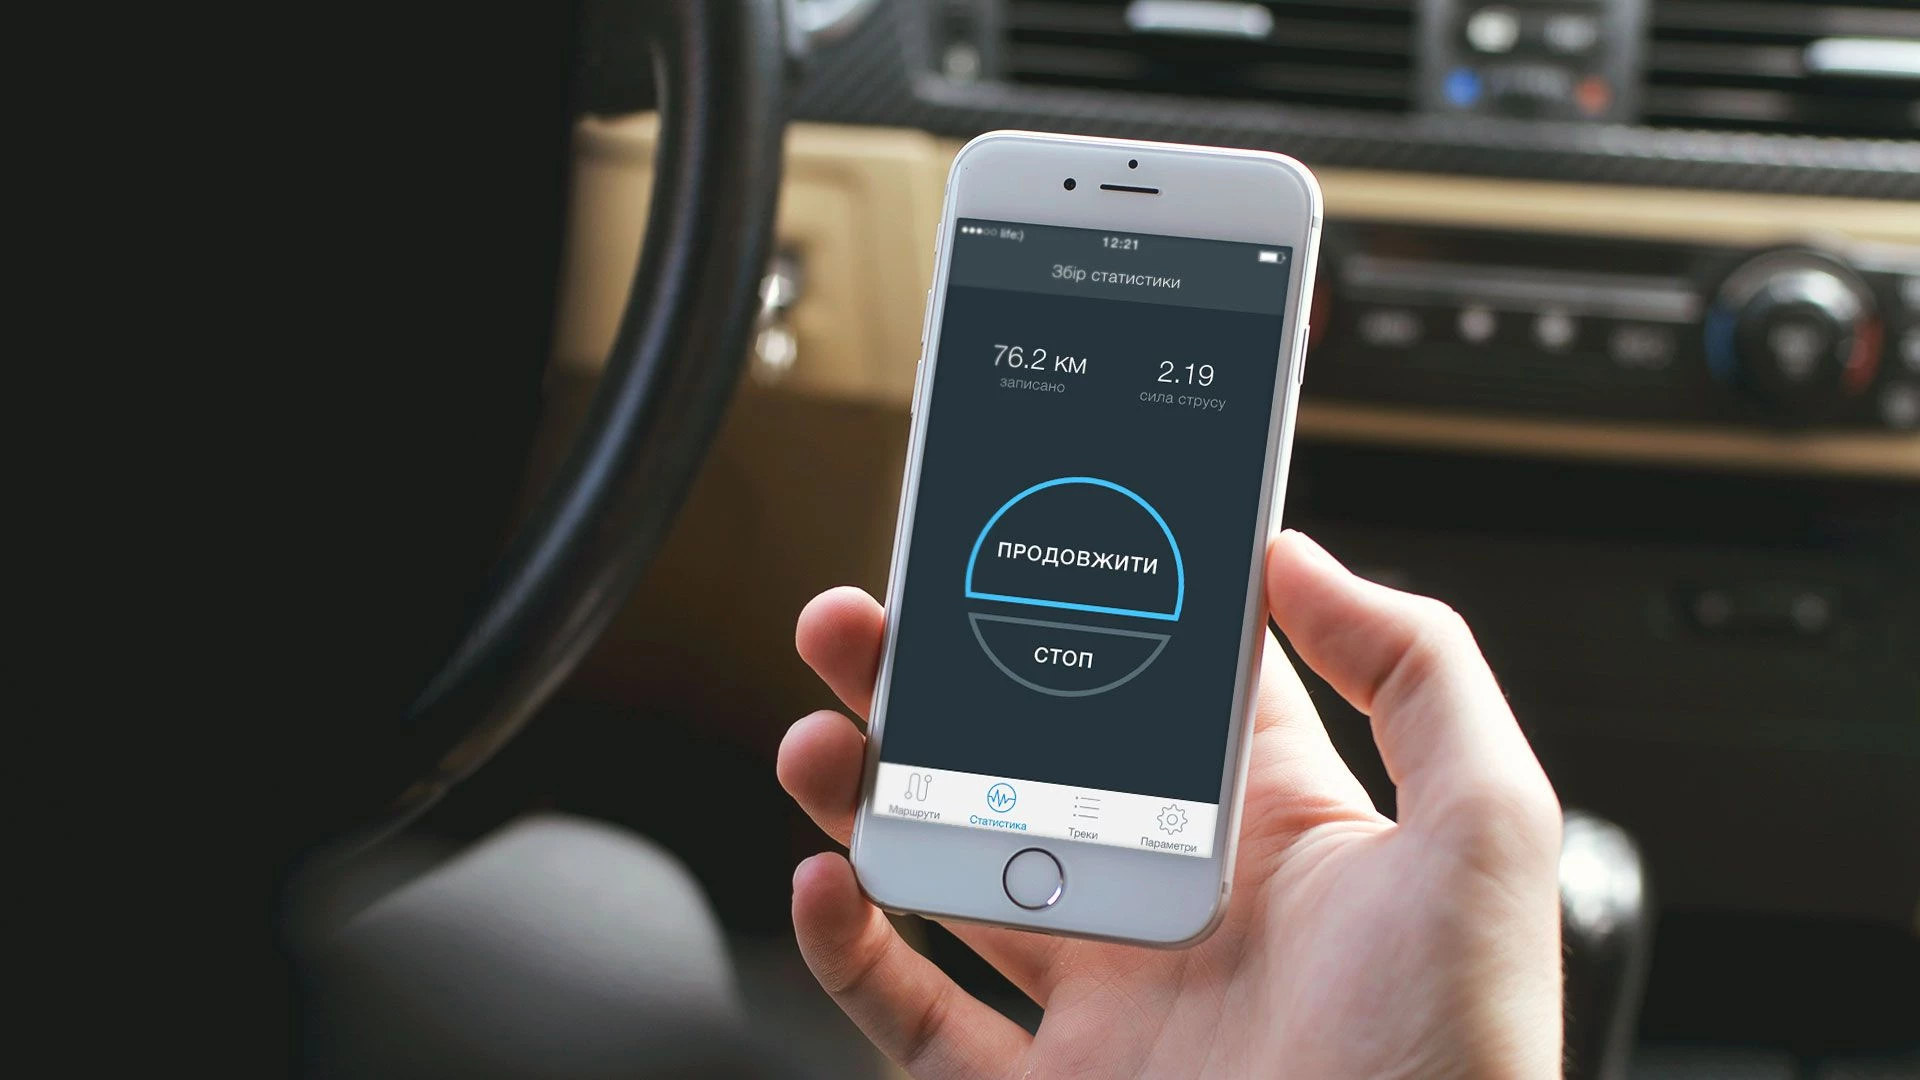
User version
When creating the app our main objective was to improve safety on the roads. So we needed to minimize all the distracting factors that may arise when using it.
User app was based on the experimental version. We developed convenient UI and two algorithms for working with the app — manual and automatic. Work of the automatic mode depends on many factors, one of which is the strength of the GPS signal. If the signal is poor, user can use the manual mode. They can also determine how to send tracks: via Wi-Fi or mobile network, manually or automatically.
We were developing native apps for two platforms, Android and iOS, simultaneously. For contacting RestFull API of the server we were using robospice library on Android but later it was replaced with Retrofit2.0 and OkHttp bundle. We used SQlite as a local database for storing recorded tracks but are planning to replace it with Realm. The minimum supported version of the SDK is v9. The app extensively uses Google Play Services, that’s why it is important that a user has their up-to-date version installed on the device.
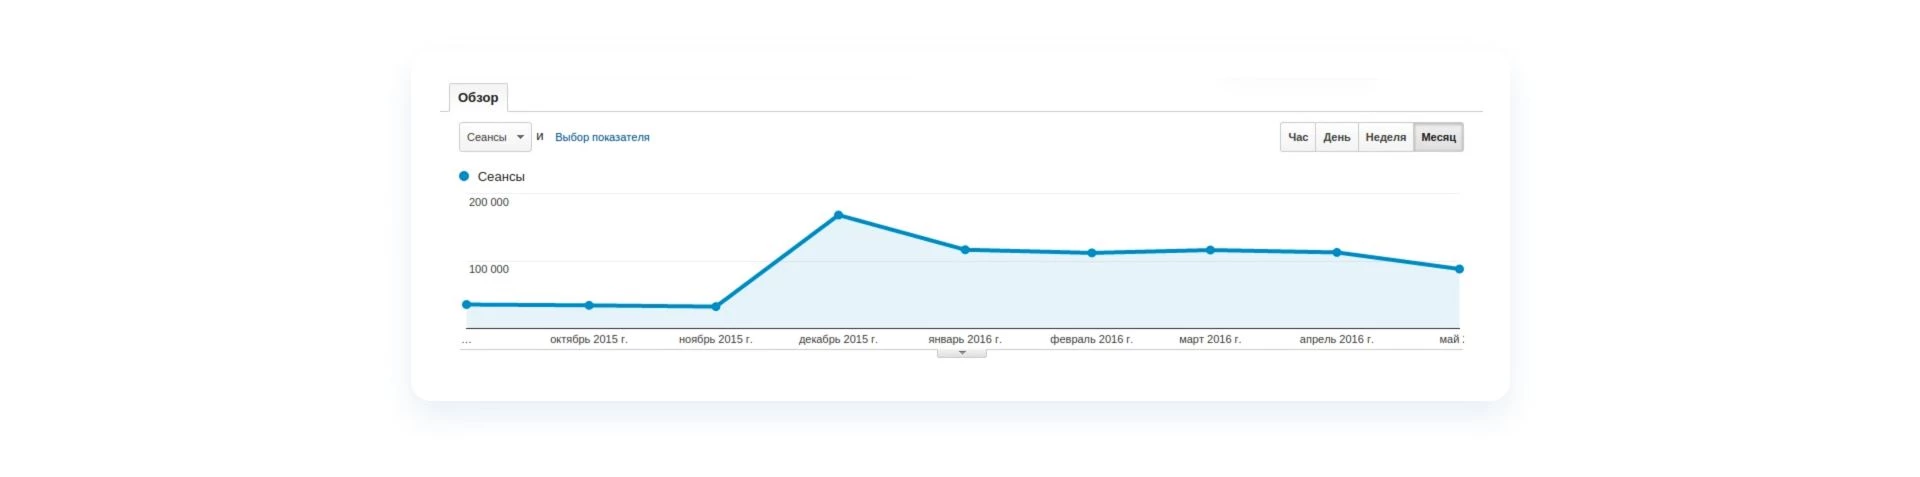
So the first user version of the app had only functions for gathering statistics. Routing from A to B was still far away, not to mention a navigator. But everybody believed in the success of the project, first and foremost thanks to our community of users who were very supportive and waited eagerly for the product release.
Data analysis
Shortly after releasing a consumer version we have received first real data from users and calculated the number of holes detected by them. The team started looking for approaches that would help to average out values, correlate results and put them on the map in the respective color using scale we built when experimenting.
The first problem we needed to solve was binding of GPS tracks recorded by users to the respective road outlines on the map. Since accuracy of electronic maps and sensors installed on the devices is not perfect, you can’t simply connect GPS points with lines and put them on the layer above the map. If you do so, after zooming in the map you’ll see something similar to a cardiogram on top of each road.
To avoid this and other discrepancies we have divided all the roads on the map into segments, 30-50 meters each. GPS points from user tracks that were matching remotness and movement direction criteria for a segment were bound with it and saved in the database for further analysis. This way we got a map of GPS tracks and a database with sorted points and data from the accelerometer. This is a simplified description of the process since many criteria and pitfalls were skipped to make it easily understandable by a broader audience.
The second task was data analysis. On a more abstract level it can be divided into several steps:
- Validation. Since data coming from users is not 100% trustworthy, it should be validated. In order to do it we use a simple mathematical model describing car behavior on the road. By comparing sequence with criteria from the model algorithm we identify whether a particular track should be transferred to the next stage of statistical analysis (valid) or discarded (invalid).
- Statistical analysis. It is identifying sites where sequences match some patterns indicating that there is a defect on this road segment. We evaluate the probability of correctness of the conclusion about this road segment and shake strength recorded by sensors on this part of the road. Then a hole is shown on the map. Evaluation is always based on the data with a certain relevance period and sufficient volume for conducting statistical analysis.
Thus, with a constant stream of GPS tracks from users and an algorithm that validates incoming tracks in real time and adds them to the total statistics we get a live road map based on real-time data. We worked for six months and experimented with several approaches to come up with an adaptive algorithm described above.
Tie-ups
What can affect the accuracy of end results? The answer is simple: external factors, such as weather conditions, human factor, technical issues and so on. With math you can spend enormous amount of time on complicating algorithms by adding more and more variables from the real world into the problem.
But it will drastically increase resource consumption. And users won’t be happy with app draining their battery in no time. Plus, server part doesn’t have an unlimited computational resource either. That’s why looking for results with accuracy level that satisfies given requirements and budget is an established practice in math. So we had to balance everything up.
Here’re some numbers:
- Accuracy of GPS in mobile devices: 5-10 meters with 60% probability of ending up within the diameter of this circle.
- 20% error in determining speed.
Apart from devices with damaged or defective sensors that have lost their accuracy and need additional calibration there’s also a problem with abnormal data that can sometimes be sent by working devices. Algorithm filters out these anomalies but while working on this problem we have discovered the following:
- You can’t treat GPS as a constant value: signal level is influenced by many factors starting with device location inside the car to the material with which the car body is made. There’re also places with no signal at all. Some of them aren’t properly covered with satellites and so the location can’t be determined. Others have enough coverage but OS still doesn’t provide updated data on location. In any case, in such places all applications that are using GPS in that moment behave identically.
- Since data from the accelerometer is not bound with any spatial axis and is analyzed as a whole, we get data on riding comfort for road surface including sideways acceleration on turns, hard accelerations and breaks.
The last factor is rather tricky. On the one hand, it tells us that in a particular place the driver has abruptly hit accelerator or brakes (maybe he or she was trying to evade a road defect). On the other hand, we get the same data from reckless drivers passing through crossroads and entering turns on full speed. The team is working on finding useful application of this peculiarity.
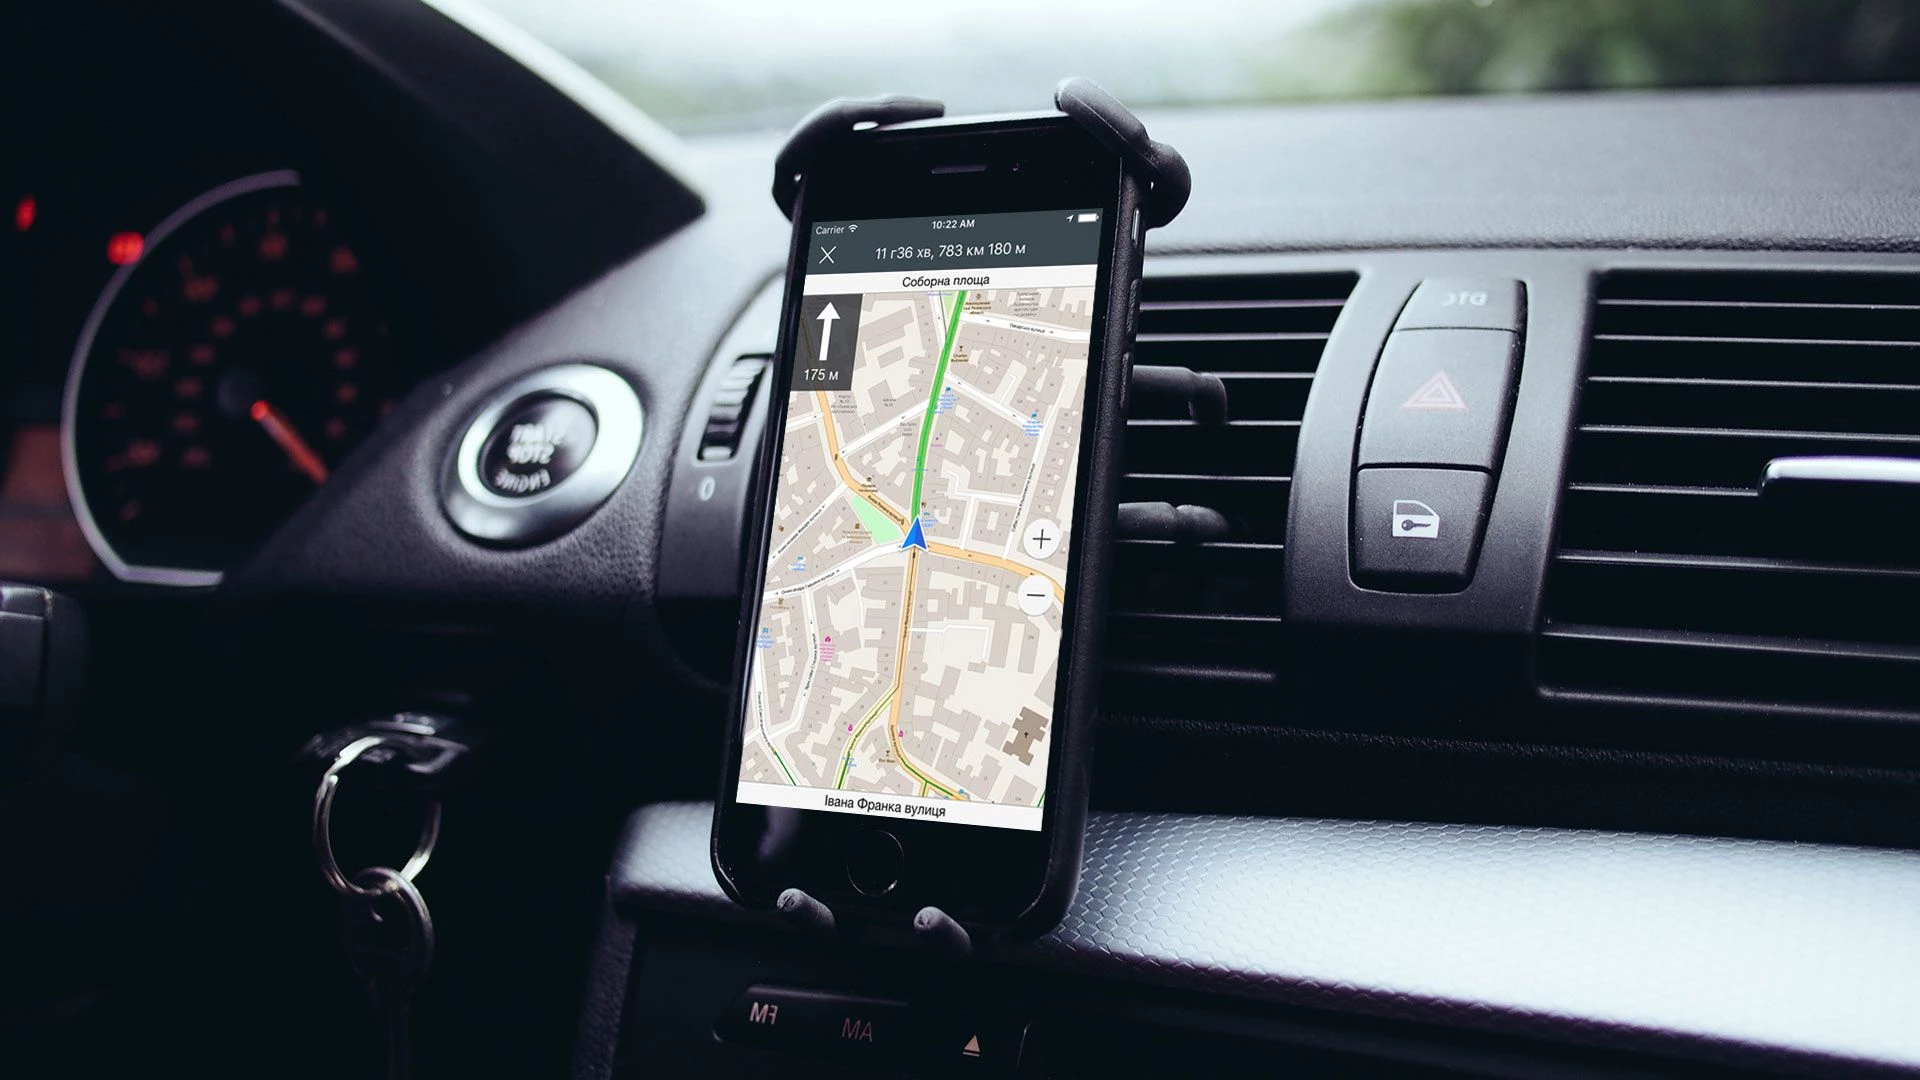
Navigator development
The server constantly processes raw data sent by users on a non-stop basis — and that’s about 1000 tracks per day. Therefore, the map is continuously updated with new processed data. Now it’s about time we use the collected statistics for the benefit of the community that helped gather it.
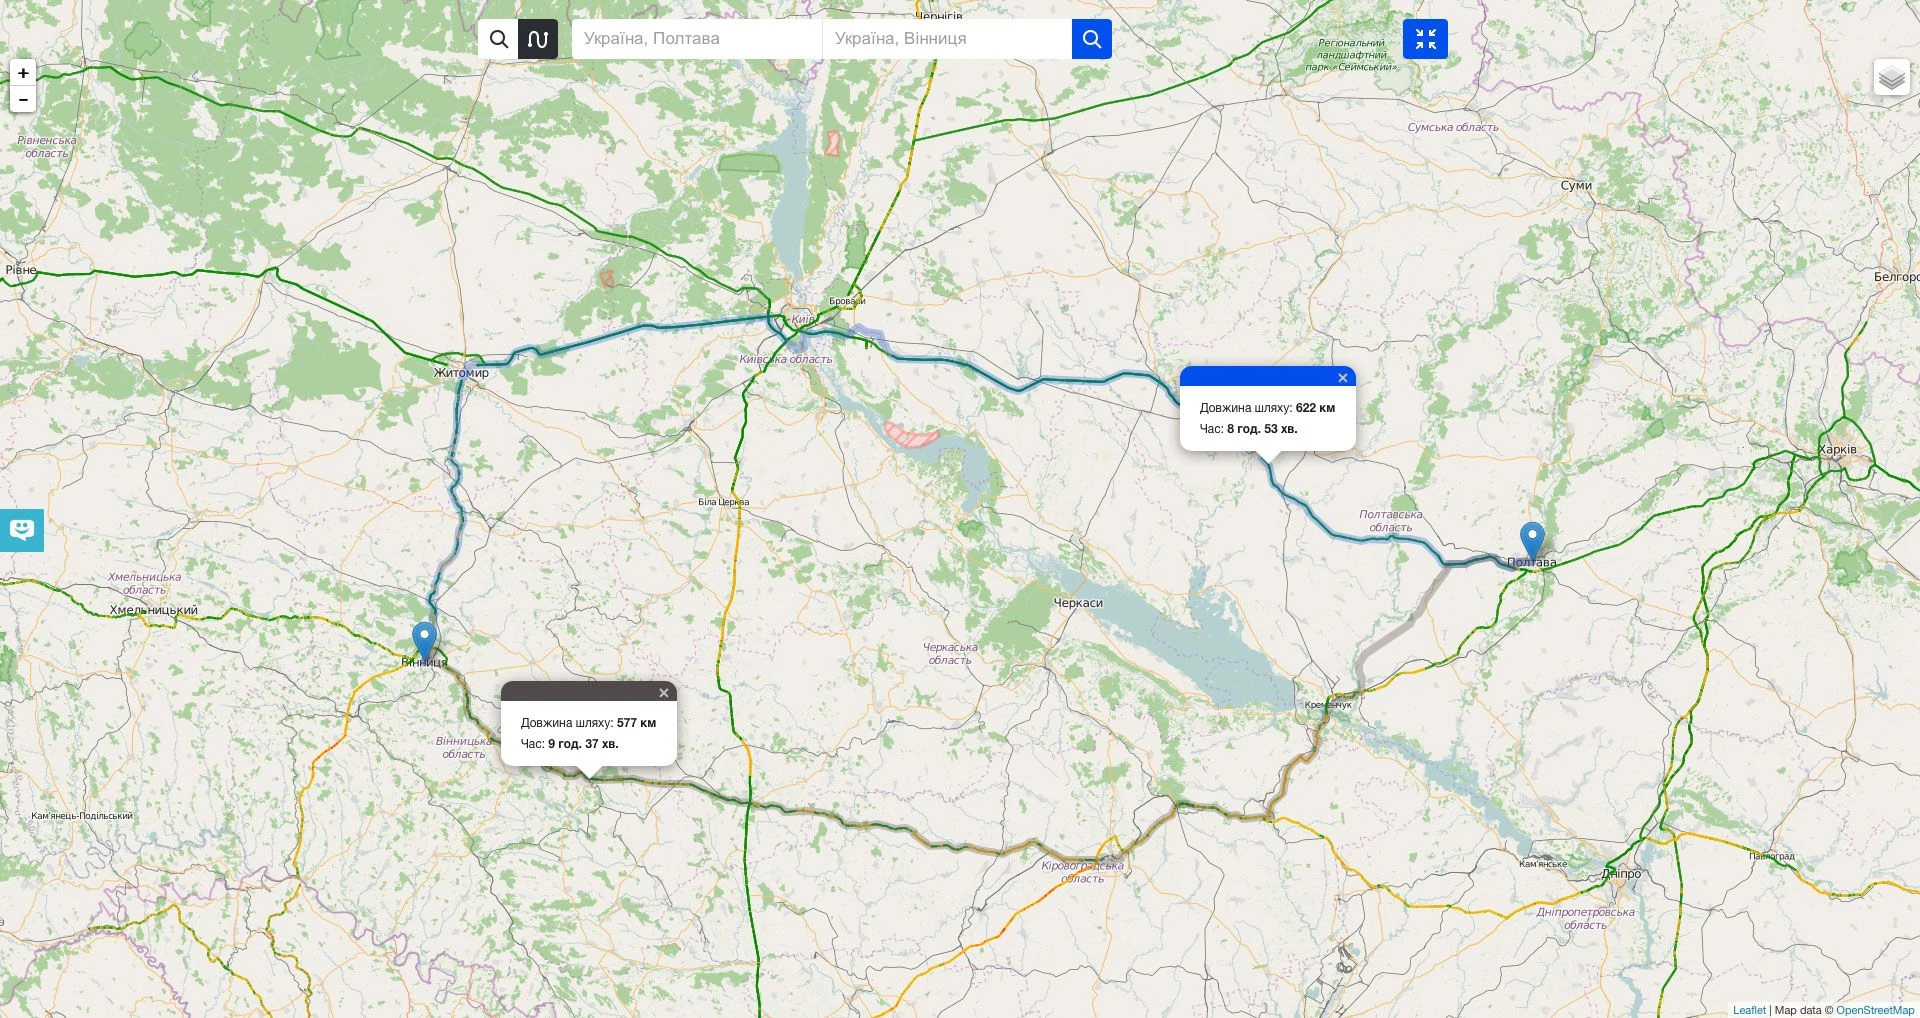
The map on the website is quite informative if you’re a driver experienced in building routes and don’t need a navigator. But if you’re used to driving in the city and need to go to the countryside, you should be ready for the world of pits, potholes and bumps. Of course, it would be convenient if you could build a route that has fewer of these delights. Since developing a navigator was one of our initial goals, the team was looking forward for the day we could start working on this feature.
While developing the navigator, we decided to hire third-party developers experienced in this field. It helped us to save a lot of time and avoid problems specific to navigator development. Special thanks to the guys from Dnepropetrovsk, who helped us out with this.
‘Why make your own navigator if there are plenty of ready-made and popular solutions such as Google and Yandex?’, you may ask. Well, it isn’t as easy as that. In order to provide the user with the most safe and convenient route, we need to specify all the waypoints between the starting point and the final destination. Unfortunately, none of the major popular navigators are able to do this. They only allow you to set start and end points of the route.
Sometimes more advanced solutions offer a handful of waypoints, but that still isn’t good enough for our purposes. We contacted the developers of the most popular products and discussed the possibility of integration with their applications. Some of them got interested, but such negotiations take time, and we need a navigator developed now. Therefore, not excluding the possibility of partnership, we have created our own solution.
We are certain that the quality of Ukrainian roads is a concerning issue for every car driver. UARoads startup received over 1200 tracks from its users. The 54% of Ukrainian roads were processed.
Cast:
-
 Stepan Tanasiychuk
CEO & Founder
-
Igor Fedun
Manager
-
Dima Kovalenko
Manager
-
Yulia Kondratyuk
Project Manager
-
Oleg
Designer
-
Vadim Gumenniy
Back End Developer
-
Alex Lensky
Back End Developer
-
Timur
Back End Developer
-
Yevhen
System Administrator
-
Oleksandr
Android Developer
-
Anton
Android Developer
-
Konstantin Kolesnik
iOS Developer
-
Oleksandra
PR Manager


Case Studies
-
MeinFernbus
Web project and website design for Germany's largest passenger transportation company
-
BenzinPreis24
Service for efficient search of petrol stations in Switzerland
-
SmartSeeds
Innovative service for cargo transportation


